Beware the long tail!
We’ve previously written in this column about this summer’s El Nino conditions, what it might look like for irrigation water demand and supply, and the likelihood of a drought this summer.
After what felt like a reasonably slow start, since Christmas we’ve had periods of hot, dry nor-west conditions that have resulted in some high evapotranspiration values at times. Anecdotally we’ve been hearing that some irrigation systems have been struggling to keep up. This isn’t a surprise, as we’ve had several periods where evapotranspiration has been higher than the design capacity of most irrigation systems for multiple days in a row.

Climate scientists and weather forecasters have indicated that this year’s El Nino is likely to be quite different to previous summers such as 1997-98 and 2015-16 due to the current combination of conditions in the Pacific. We are likely to see a long “tail” with dry conditions continuing through into autumn. The question on many people’s minds in Canterbury will be whether this also translates into a long irrigation season.
Based on modelled irrigation demand for mid-Canterbury, using measured climate records from 1960 through to present day (mid-February 2024), it is already shaping up to be an above-average summer in terms of irrigation water requirements, even though we don’t yet have a full season of data to compare to the historic record.
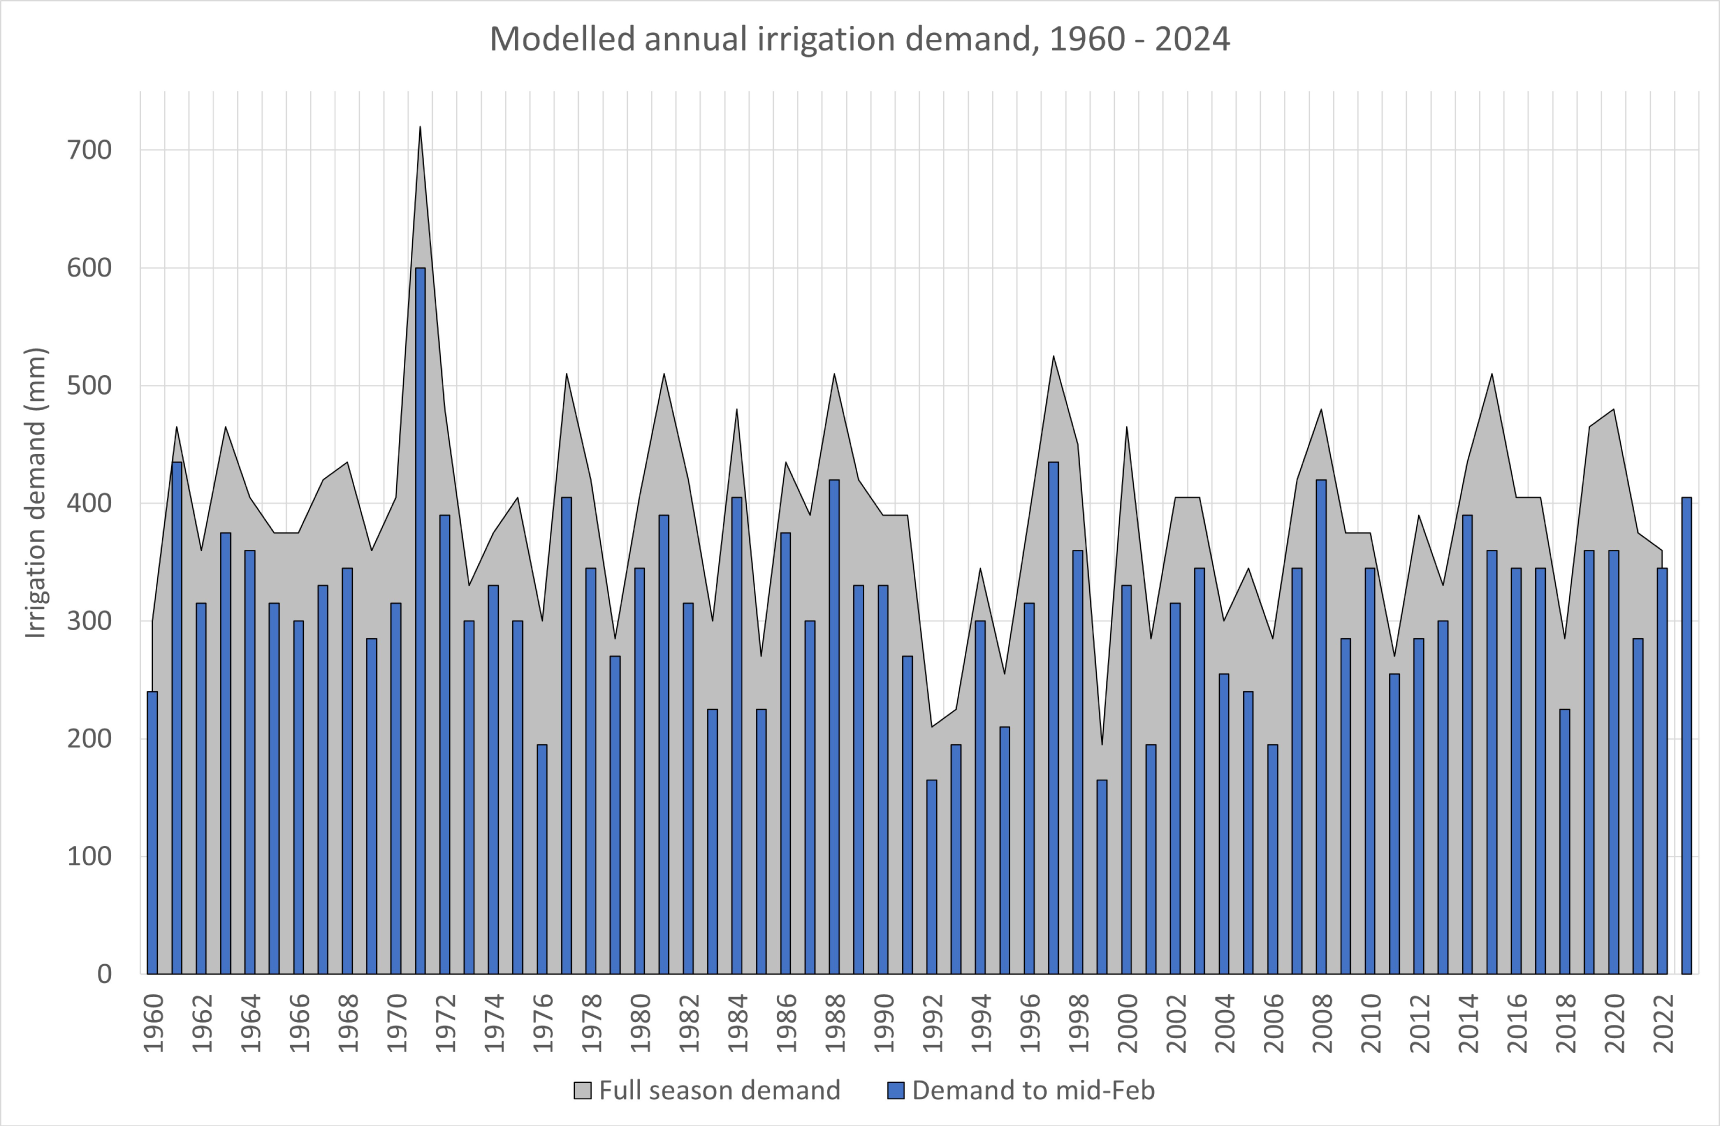
So, does history tell us anything about whether irrigation demand through to mid-February is an indicator of the remainder of the season? In general, there’s a reasonably strong relationship between what has happened up to this point of the season and what we’re likely to see over the next couple of months: for example, if demand through to mid-February was in the 90th percentile (i.e. drier than 9 years out of 10, on average) compared to the equivalent period in historic records, it’s highly likely that there will be a similar outcome for the season as a whole. Some years can surprise us: 2015-16 was very dry overall (higher than the 90th percentile) for the full season, but in mid-February 2016 the irrigation demand was tracking around the 70th percentile.
Our modelling shows that at this point in the irrigation season (mid-February) the volume of water used for irrigation is, on average, 80% of the full season’s water use. While this percentage varies from year to year, it is reasonably consistent around the average for high-demand years.
A key message is that irrigation water-users who are operating within the constraints of an annual volume limit on their resource consents should keep a close eye on this, particularly if the volume of water used so far this season is more than around 70% of the limit. After two relatively wet irrigation seasons, this could be a year when some people reach their limits, or don’t have much to spare.
El Nino also has implications for the availability of water. We’re fortunate in Canterbury that flows in our alpine rivers are typically higher in El Nino years due to the prevalence of westerly weather conditions. This is not a guarantee however, and some rivers (both the alpine rivers and those with catchments that don’t extend as far inland) have already experienced restrictions this season. Stored water, or groundwater that is not subject to restrictions based on river flows, are the only real solutions to this. If the latter part of the summer turns out to be very dry, it could result in re-focused thinking on storage development.